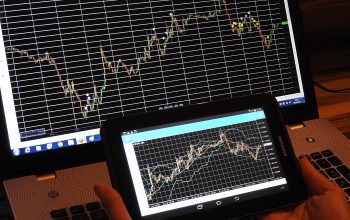
To make money out of stock trading, every trader must perform technical analysis and read charts. Read on to learn the basics of technical analysis and charting, and how traders can leverage them to earn profits.
Technical Analysis Basics
Both investors and traders can leverage technical analysis to enter and exit a trade. Technical analysis is a medium through which investors and traders analyze historical or past data to facilitate informed decisions about a price movement in the future.
Technical analysis tools are available due to many years of application and practice in the financial market. Traders can leverage technical analysis to understand trends acquired from data such as volume and price movement.
The Earliest Structure of Technical Analysis
Candlesticks are the earliest structure of technical analysis used in the past to calculate the price movement of rice. To date, candlesticks remain the most dependable and popularly used technical analysis charting component. Traders and investors use technical analysis to:
- Understand a trend and forecast price movement
- Determine the price of the asset they plan to trade
- Understand the different multiple Candlestick and single Candlestick patterns and leverage them to determine a trade.
- Spot trading opportunities
- Find and activate the ideal stop losses for the trade.
What Expectations Should you Have when Using Technical Analysis?
Be realistic and understand that technical analysis will not deliver overnight success.
The strategy is ideal for trading but may not be effective for investing. Worth mentioning is those technical indicators present short-term signals. Investing, on the other hand, is a long-term venture that only gains from long-term signals.
Stick to your initial entry and exit plans. Do not make decisions based on emotions, as doing so could hinder your risk management strategy.
Understanding Charting
Charting is a dependable tool used in technical analysis. Here are various types of charting tools that traders should know about.
· Line Chart
The line chart is the most straightforward and most effortless to create a type of charting tool. To create a line chart, the daily completion price is outlined on the chart. The points are then connected to form a line. The key disadvantage of this charting structure is that it focuses on the closing price while ignoring the daily price action. As a result, this charting tool structure is not ideal for traders, even though many investors find it compelling.
· Open-High-Low-Close (OHLC) Charts
This form of charting pattern is more complex than line charts. All the data such as the close, low, high, and open is available on the chart. Traders can even determine the daily range from the charts. The OHLC charts are ideal for trading but ineffective for investing.
· Candlesticks
As aforementioned, candlesticks are the earliest type of charting pattern used for trading purposes. As is the case in OHLC charts, the candlesticks indicate the day’s close, low, high, open, and range. What is the difference between candlesticks and the OHLC chart? The visual charm of the chart varies. Understanding candles is more manageable than other charting methods.
Every Complete Trader Should be Conversant with Technical Analysis and Charting
A complete trader is conversant with the technical factor. He can utilize his charting expertise to make an informed decision about the stocks they should invest in. further, such traders can determine the right time to enter or exit the trade.
Character Traits of a Complete Trader
- They can choose the correct stocks just by evaluating the prevailing situation. Their proper understanding of technical analysis helps them choose the ideal trade entry price.
- One of the easiest ways to lose lots of money is entering seemingly good trades, which is often a trap. A complete trader tries to avoid the overtrading trap and only sticks to trades that meet his trading strategy.
- They possess excellent risk management skills.
- To succeed in the world of trading, traders should be well conversant with technical indicators. One of the best ways of increasing your knowledge, in this case, is by practicing on the markets.
Finally
If you are a beginner, consider risking a small percentage of the portfolio, adopt a slow pace when investing, and always have a robust risk management strategy. Adhering to these guidelines will enable you to enjoy a long and successful trading career.


