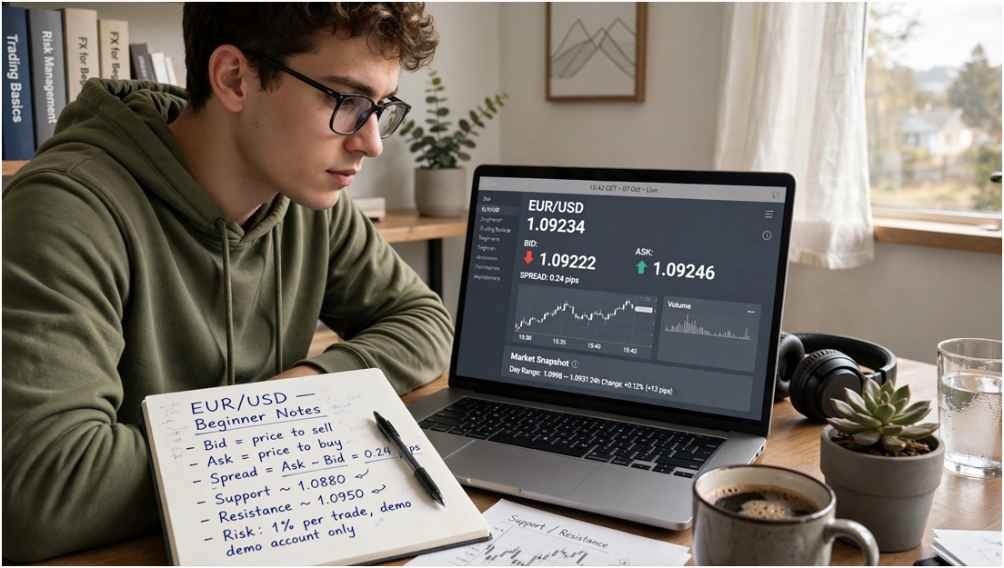

A trading strategy can look profitable on a chart and still lose money when real trades begin. The difference often comes down to transaction costs, unreliable signals, and market conditions that traders never tested.
Learning how to backtest a trading strategy helps you identify these weaknesses before putting your capital at risk. Backtesting applies predefined trading rules to historical market data, revealing how those rules would have performed under past conditions.
The process does not predict future profits. Instead, it provides evidence about a strategy’s potential profitability, risk exposure, and consistency.
What Is Backtesting, and Why Does It Matter?
Backtesting is the process of evaluating a trading strategy using historical prices and simulated trades.
Rather than assuming a particular indicator or chart pattern works, traders examine previous market movements to determine whether their approach produced repeatable results. The U.S. Securities and Exchange Commission’s investor education office emphasizes that backtested results are hypothetical, not evidence of actual investment performance.
A strategy might perform exceptionally during a strong stock market but struggle when prices move sideways. Backtesting helps reveal these differences. It also encourages consistent decision-making by replacing emotional judgments with measurable rules.
How to Backtest a Trading Strategy Step by Step
Effective backtesting requires more than scrolling through charts and identifying successful trades.
The following process creates a structured evaluation that beginners can repeat.
1. Establish Rules Before Examining Results
Start by documenting exactly when your strategy enters and exits trades.
For example, consider a moving average crossover strategy using daily stock prices.
Your rules might specify:
- Enter a long position when the 20-day moving average crosses above the 50-day moving average.
- Execute the order at the next trading session’s opening price.
- Place a stop-loss 3% below the entry price.
- Exit when the averages cross in the opposite direction.
- Risk no more than 1% of account equity on one trade.
Specify how to handle gaps, conflicting exit signals, and unavailable prices.
These details matter because changing rules halfway through testing can distort your findings.
2. Gather Historical Data That Reflects Different Markets
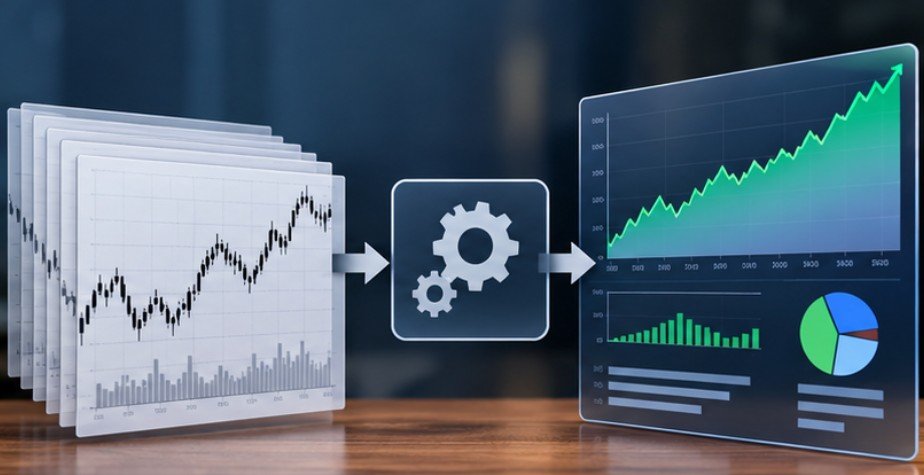
Reliable historical data should include opening, highest, lowest, and closing prices, along with volume where relevant. This information is commonly called OHLCV data. Choose records that cover rising markets, declining markets, volatile periods, and relatively quiet trading conditions.
For traders evaluating exchange-traded funds, testing performance across different market conditions is particularly useful. These results can complement practical tips for trading ETFs successfully, helping traders assess historical behavior without assuming past performance will continue.
For daily strategies, several years of data may provide useful coverage. Short-term systems often require detailed intraday records, including realistic bid-ask spreads. There is no universally sufficient testing period. The number of independent trades and diversity of market conditions matter more than an arbitrary number of months.
For U.S. stocks, use appropriately adjusted prices and account for corporate actions such as stock splits.
3. Choose Manual or Automated Backtesting
Both approaches have advantages depending on experience and strategy complexity.
| Method | Best suited for | Main limitation |
| Manual chart replay | Beginners and discretionary traders | Time-consuming and vulnerable to subjective decisions |
| Automated backtesting | Rule-based systems and repeated experiments | Requires accurate coding and execution assumptions |
| Spreadsheet testing | Simple strategies and performance calculations | Difficult to model complex intraday activity |
TradingView offers chart replay and strategy-testing functionality. Python-based frameworks provide greater flexibility for traders comfortable with programming.
Manual testers should advance historical candles sequentially without looking ahead.
Automated testers must verify that their software does not accidentally use future information.
4. Include Every Realistic Trading Expense
One overlooked expense can completely change a strategy’s apparent profitability. Account for commissions, bid-ask spreads, slippage, financing costs, and applicable exchange fees. Slippage occurs when an order executes at a different price than expected.
The Financial Industry Regulatory Authority’s guidance on trading performance claims highlights the importance of reflecting normal trading costs when presenting strategy results.
Consider a hypothetical system earning $12 per trade before expenses. If execution and transaction costs average $8, its net profit falls to just $4. This difference becomes substantial across hundreds of transactions.
5. Record Trades and Examine Performance
A trading journal should capture entry dates, exit dates, prices, position sizes, transaction costs, and outcomes. Calculate performance metrics after completing your initial sample. Avoid evaluating success solely through total profit.
A strategy generating impressive returns while experiencing enormous losses may be unsuitable for your financial circumstances.
Which Backtesting Metrics Actually Matter?

Understanding the results is just as important as generating them. The CFA Institute’s backtesting and simulation curriculum emphasizes examining risk-adjusted performance and testing strategies across changing conditions. Several measurements deserve particular attention.
Win Rate, Profit Factor, and Expectancy
Win rate measures the percentage of profitable trades. A 45% win rate does not automatically indicate failure. A system can remain profitable when average winning trades are substantially larger than average losses.
Profit factor divides gross trading profits by gross trading losses. Values above 1 indicate positive historical net trading results before any omitted expenses. Expectancy estimates the average outcome per trade.
Suppose 40% of trades earn $200 while 60% lose $100.
Expected result = (0.40 × $200) − (0.60 × $100) = $20 per trade.
That represents positive historical expectancy, assuming the sample and execution costs are reliable.
Drawdown and Risk-Adjusted Returns
Maximum drawdown measures the largest peak-to-trough decline in account equity during a test.
A strategy earning 25% while experiencing a 40% drawdown may expose traders to unacceptable risk.
The Sharpe ratio compares returns above a risk-free benchmark with return volatility.
However, Sharpe ratios can overlook certain extreme-loss risks, especially when returns are irregular or heavily skewed.
Review these statistics together rather than relying on one attractive number.
How Can You Tell Whether Backtesting Results Are Reliable?
A convincing historical equity curve can hide serious methodological problems.
Watch for Overfitting and Hidden Bias
Overfitting occurs when traders repeatedly adjust parameters until a strategy matches historical price movements unusually well.
Researcher Robert Novy-Marx examined this problem in a National Bureau of Economic Research paper on multi-signal strategies. His findings demonstrated that seemingly impressive historical results can emerge from combinations of signals lacking genuine predictive power. Other common problems include:
- Look-ahead bias: Using information unavailable when the simulated trade occurred.
- Survivorship bias: Testing only securities that survived, excluding failed or delisted companies.
- Selection bias: Choosing favorable assets or periods after examining results.
- Unrealistic execution: Assuming every order fills immediately at the desired price.
A useful safeguard is checking whether modest changes to strategy parameters produce dramatically different outcomes.
Reserve Unseen Data for Walk-Forward Testing

Divide historical records into development and validation periods. For example, use an earlier period to develop the strategy and a later, untouched period to evaluate it.
Walk-forward testing extends this principle by repeatedly recalibrating on past observations and evaluating the next unseen segment. If profitability disappears outside the development sample, the original results deserve skepticism. Finally, use paper trading to evaluate live signals without committing real capital.
Frequently Asked Questions
1. How many trades are needed for reliable backtesting?
There is no guaranteed minimum. Testing 100 or more trades can provide an initial sample, but statistical confidence depends on strategy variability, trade independence, and market conditions.
2. Can beginners backtest without coding?
Yes. Beginners can use chart replay software and spreadsheets to record hypothetical trades, calculate performance statistics, and evaluate predefined rules without programming.
3. Is backtesting useful for forex trading?
Yes. Forex traders can evaluate currency-pair strategies using historical exchange rates while accounting for spreads, rollover charges, leverage, and changes in market liquidity.
4. Does a profitable backtest guarantee future returns?
No. Historical patterns can change, and live execution may differ from simulations. Forward testing and disciplined risk management remain necessary.
Test the Weaknesses, Not Just the Profits
The greatest value of backtesting is discovering where a trading strategy might fail before those weaknesses become expensive.
Backtesting is also one part of a broader trading discipline, so understanding how to manage your trading portfolio can help traders consider strategy performance alongside their overall risk exposure and capital allocation.
A credible test examines losing periods, execution costs, market shifts, and uncomfortable drawdowns alongside profitable trades.
Maintaining discipline during these challenging periods is equally important, and following a structured market routine for emotional day traders can help traders manage emotional reactions and make more consistent decisions when market conditions become stressful.
Start with one clearly defined strategy. Gather suitable historical data, simulate trades consistently, and document every meaningful result.
Then challenge your findings using unseen data and paper trading.
Remember that a beautiful historical performance chart is not proof of a profitable future. The most useful backtest is the one that exposes enough weaknesses to help you make better decisions.