

A market can reach a new high even while its underlying momentum is weakening. That contradiction is exactly what the rsi divergence trading strategy helps traders identify before a potential price reversal.
Instead of relying exclusively on overbought or oversold readings, this approach compares price movements with the Relative Strength Index (RSI). When the two begin moving in opposite directions, traders receive an early warning that the current trend may be losing strength.
However, divergence alone does not guarantee a reversal. The real advantage comes from combining momentum signals with market structure, confirmation, and disciplined risk management.
What Is RSI Divergence and Why Does It Matter?
RSI is a technical momentum indicator developed by J. Welles Wilder. It measures the strength of recent price gains relative to losses on a scale from 0 to 100. The standard calculation uses 14 periods, although traders can adjust this setting. Traditionally, readings above 70 indicate overbought conditions, while readings below 30 suggest oversold conditions.
According to the CFA Institute’s technical analysis materials, momentum indicators help analysts assess buying and selling pressure. Disagreement between momentum and price can provide an early warning of weakening trends.
This matters because prices do not always reverse immediately after momentum begins deteriorating. Divergence identifies that potential weakness before the price chart necessarily confirms it.
Four RSI Divergence Patterns Every Trader Should Recognize
Understanding the difference between regular and hidden divergence is essential because they suggest different trading opportunities.
| Divergence type | Price movement | RSI movement | Potential outcome |
| Regular bullish | Lower low | Higher low | Upward reversal |
| Regular bearish | Higher high | Lower high | Downward reversal |
| Hidden bullish | Higher low | Lower low | Uptrend continuation |
| Hidden bearish | Lower high | Higher high | Downtrend continuation |
Regular Divergence Warns About Reversals
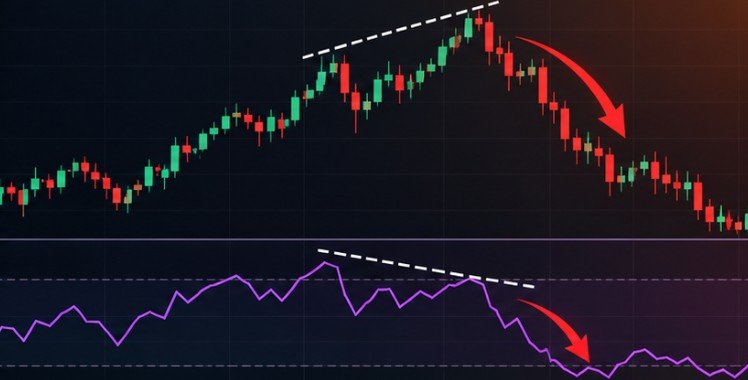
Regular bullish divergence develops when prices fall to a new low but RSI establishes a higher low. For example, suppose a stock declines from $75 to $69, rebounds, and eventually drops to $67. If RSI rises from 24 at the first low to 33 at the second, selling momentum may be weakening.
Regular bearish divergence works oppositely. Price reaches a higher high while RSI makes a lower high, suggesting that buying momentum is slowing. The CMT Association’s analysis of RSI divergences illustrates how analysts evaluate these signals alongside established support and resistance areas.
Hidden Divergence Suggests Trend Continuation
Hidden divergence can help traders identify opportunities within existing trends. During an uptrend, hidden bullish divergence appears when price establishes a higher low while RSI records a lower low.
During a downtrend, hidden bearish divergence forms when price makes a lower high while RSI creates a higher high. These patterns suggest that temporary countertrend movements may be losing strength. However, they are more meaningful when the broader market structure supports the anticipated continuation.
How to Build an RSI Divergence Trading Strategy
A repeatable trading process should establish the market environment before identifying individual signals.
Step 1: Establish the Dominant Trend
Start with the daily or four-hour chart to reduce exposure to short-term fluctuations. Evaluate whether prices are creating higher highs and higher lows, lower highs and lower lows, or moving sideways. The 50-period and 200-period moving averages can provide additional trend context.
Regular divergence near established support or resistance deserves attention, while hidden divergence is generally more relevant during clear trends.
Step 2: Compare Matching Price and RSI Swings
Apply the 14-period RSI indicator. Identify two distinct swing highs or two swing lows on the price chart. Next, compare the corresponding turning points on RSI.
Use completed candles and clearly formed swings rather than attempting to predict unfinished patterns. Avoid connecting unrelated turning points separated by inconsistent time intervals.
Step 3: Require Price Confirmation
This is where many traders become impatient. A divergence signal indicates weakening momentum, not necessarily an immediate trading opportunity.
Possible confirmation signals include:
- A break above nearby resistance following bullish divergence.
- A breakdown below local support following bearish divergence.
- A confirmed change in swing-high and swing-low structure.
- A reversal candlestick pattern supported by subsequent price movement.
- An RSI crossing above or below the 50 midpoint.
For additional perspective, the CMT Association explains that elevated RSI readings and bearish divergence do not automatically predict major market tops. It’s What Happens Next. Waiting for confirmation may produce a less attractive entry price, but it can help filter premature signals.
Step 4: Define Entry, Stop-Loss, and Profit Target

For a confirmed bullish setup, consider entering after price breaks the relevant local resistance level. Place the protective stop below the recent swing low, allowing a suitable buffer for volatility.
For bearish setups, reverse these conditions. Profit targets can reference nearby support, resistance, or a predetermined reward-to-risk ratio. A commonly tested framework seeks at least $2 in potential profit for every $1 risked, provided the chart supports that target.
Why RSI Divergence Sometimes Produces False Signals
Divergence can remain visible for several candles while an established trend continues. This frequently happens during powerful directional movements, when traders mistake slowing momentum for an immediate reversal. Three common problems deserve particular attention.
Trading Against Strong Market Momentum
A bearish divergence within a powerful uptrend may lead to sideways consolidation rather than a significant decline.
Ignoring Important Economic Events
Federal Reserve announcements, inflation reports, and major corporate earnings can rapidly change market expectations. Technical signals may become less dependable during sudden volatility.
Treating Every Divergence as Equal
Signals in choppy markets can appear repeatedly without producing meaningful directional moves. Support, resistance, trend structure, and confirmation help distinguish worthwhile setups from random fluctuations.
The National Futures Association’s investor guidance emphasizes understanding market risks and using capital that traders can afford to lose. For greater consistency, traders should also develop habits for avoiding violations of their trading rules.
Frequently Asked Questions
1. Is RSI divergence reliable for beginners?
RSI divergence can help beginners recognize weakening momentum, but it is not consistently reliable by itself. Combining it with price confirmation, market structure, and controlled risk improves decision-making.
2. Which RSI setting works best for divergence?
The 14-period setting is a practical starting point. Shorter periods generate more signals, while longer periods smooth fluctuations. Traders should test settings against their chosen market and timeframe.
3. Can RSI divergence work in forex trading?
Yes. Traders apply RSI divergence to currency pairs to identify possible reversals and trend continuations. However, leverage, spreads, economic announcements, and market volatility introduce additional risks.
4. Is bullish divergence always a buy signal?
No. Bullish divergence indicates that downward momentum may be weakening. Traders typically wait for resistance breaks, market structure changes, or another confirmation before considering an entry.
Let Price Confirm What Momentum Suggests
The most valuable lesson from an rsi divergence trading strategy is that weakening momentum and reversing prices are not the same thing. Divergence draws attention to potentially important market changes, but price action determines whether those changes deserve a trade.
I prefer treating every divergence as a candidate rather than a command. That means checking the broader trend, waiting for confirmation, calculating risk, and accepting that some promising patterns will fail.
Before committing real capital, test the rules on historical charts and a simulated account. Successful trading is not about predicting every reversal; it is about making disciplined decisions when uncertainty remains.