

A trading chart can reveal useful market information without a single technical indicator. The challenge is knowing which price movements deserve attention and which are simply noise.
That is why price action trading strategies for beginners focus on three essentials: market direction, important price levels, and candlestick behavior.
Instead of waiting for several indicators to agree, traders study how prices respond to buying and selling pressure. The approach works across stocks, forex, and futures, although no chart pattern guarantees a profitable trade.
What Is Price Action Trading, and Why Does It Matter?
Price action trading is a technical analysis approach that uses historical and current price movements to evaluate potential trading opportunities.
Traders primarily examine candlestick charts, swing highs and lows, support and resistance zones, and breakout patterns.
Unlike indicator-heavy strategies, price action trading does not require moving averages, RSI, or MACD to generate signals.
The advantage is simplicity. The limitation is interpretation: two traders can examine the same chart and reach different conclusions.
For beginners, successful chart analysis starts with understanding market structure rather than memorizing dozens of candlestick formations.
Learn to Read Market Structure Before Trading
Market structure describes how prices move through successive highs and lows. Recognizing these movements helps traders distinguish trending markets from sideways conditions.
Identify Uptrends, Downtrends, and Ranges

An uptrend generally produces higher highs and higher lows. Buyers repeatedly push prices upward while corrections remain above previous significant lows. A downtrend develops through lower highs and lower lows, suggesting continued selling pressure.
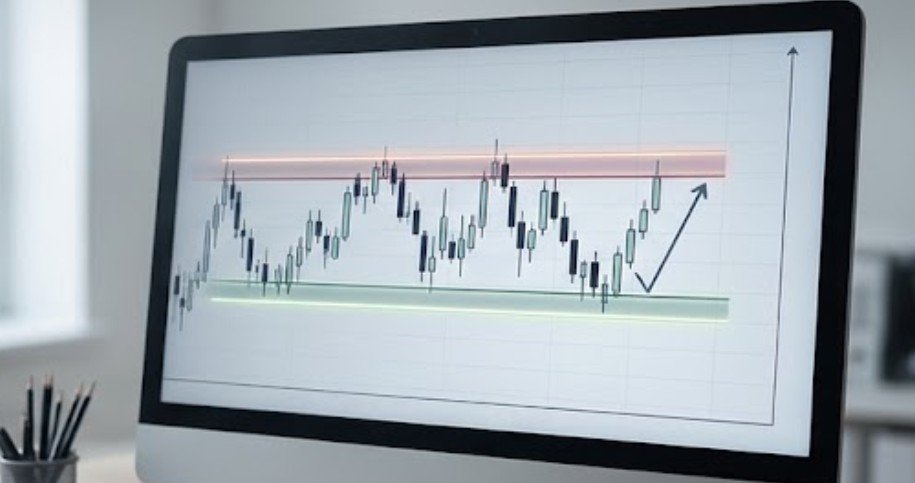
Sideways markets behave differently. Prices fluctuate between relatively stable upper and lower boundaries.
I recommend identifying the prevailing structure on a daily or four-hour chart before examining individual trading opportunities.
Understand Support and Resistance Zones
Support represents an area where buying interest has previously slowed or reversed a decline. Resistance marks an area where selling pressure has interrupted an advance. These levels are better treated as zones rather than exact prices.
A previous resistance area can also become support following a successful breakout. This concept helps traders identify potential entry locations, profit targets, and points where their trading assumptions become invalid.
Three Practical Price Action Trading Strategies for Beginners
The following setups provide clear conditions to observe without requiring complex technical indicators.
1. Support and Resistance Rejection Strategy
This approach looks for evidence that price has attempted to cross an established market level but failed. A pin bar is one possible rejection signal. It features a relatively small candle body and a long wick.
A long lower wick near support suggests that prices declined before recovering. A long upper wick near resistance suggests that an upward move faced selling pressure.
For a potential bullish trade:
- Identify an established support zone.
- Wait for price to reach that area.
- Look for a candle with a pronounced lower wick.
- Consider confirmation through a subsequent bullish close.
- Position the protective stop beyond the rejection low, allowing for market volatility.
The location matters more than the candle alone. A pin bar appearing in the middle of an undefined trading range may provide little useful information.
2. Trend Pullback Strategy
Strong trends rarely move continuously in one direction. Temporary corrections often provide more measured entry opportunities than chasing rapidly advancing prices.
Suppose a stock advances from $80 to $92 before pulling back toward $87.
If $87 aligns with a previous support area, traders might watch for renewed buying activity.
A bullish engulfing candle or strong upward close could suggest the larger trend is resuming.
A protective stop would typically sit below the relevant swing low.
The primary risk is confusing a temporary correction with the beginning of a genuine trend reversal.
3. Inside Bar Breakout Strategy
An inside bar forms when a candle’s entire high-to-low range remains within the preceding candle’s range.
This formation reflects temporary price compression.
Traders watch whether price subsequently breaks above or below the consolidation.
For example, assume a stock’s preceding candle ranges from $105 to $110, while the inside candle ranges from $107 to $109.
A breakout above $109 could attract bullish interest, particularly if the broader trend is upward.
However, traders should distinguish a breakout beyond the inside bar from a stronger confirmation beyond the preceding candle’s high.
Stops may be placed beyond the inside bar’s opposite boundary when justified by volatility and position size.
False breakouts remain common, especially around major announcements.
Position Sizing and Risk-to-Reward Calculations
Even a technically reasonable trading setup can fail. Risk management determines how much damage an unsuccessful trade can cause. Consider a hypothetical $5,000 trading account with a self-imposed risk limit of 1% per trade.
The maximum planned loss would be $50.
Suppose a stock trade has:
| Trading element | Value |
| Entry price | $100 |
| Stop-loss price | $98 |
| Profit target | $104 |
| Risk per share | $2 |
| Planned reward per share | $4 |
| Position size | 25 shares |
This produces a planned risk-to-reward ratio of 1:2.
Traders can also compare this setup with a 1 to 3 risk reward ratio strategy to understand how different profit targets affect the break-even win rate and the potential outcomes of a trade.
Ignoring transaction costs, winning trades earn twice the amount lost on unsuccessful trades. The theoretical break-even win rate is approximately 33.3%.
However, spreads, commissions, slippage, and market gaps can worsen actual results.
The SEC explains in its stop-order investor bulletin that stop prices do not guarantee execution at the specified level.
Investor
Therefore, the planned $50 loss is not an absolute maximum.
Common Mistakes That Undermine Price Action Trading

Beginners frequently focus on attractive chart formations while overlooking the surrounding conditions.
One mistake is treating every candlestick reversal as a trading opportunity. Without meaningful market context, the signal may have limited predictive value.
Another is relying on extremely short timeframes where rapid fluctuations make decisions harder.
Traders using contracts for difference should also understand how CFD trading can help you develop a winning strategy while accounting for leverage, market volatility, and the importance of disciplined risk management.
Trading through major economic announcements also introduces unpredictable price movements.
The Commodity Futures Trading Commission reported that approximately two-thirds of customers at registered OTC forex dealers lost money during its cited 2021–2022 reporting period. This historical finding highlights the risks of speculative currency trading.
Beginners should also consider the National Futures Association’s investor guidance, which emphasizes using only money that can be lost without affecting essential financial needs.
How to Practice Without Risking Real Money
Start by selecting one liquid market and one price action setup.
Review historical charts, document qualifying signals, and record hypothetical entry prices, stop levels, targets, and outcomes.
After studying at least 30–50 examples, examine whether the strategy produced positive results after estimated trading costs.
For a more structured evaluation, learn how to backtest a trading strategy using historical price data, predefined entry and exit rules, and realistic transaction costs before relying on a setup in live markets.
Then test it through paper trading under current market conditions. Keep a journal of mistakes, changing market conditions, and emotional decisions.
The Financial Industry Regulatory Authority also warns that frequent trading introduces additional costs and potential tax consequences. Neither backtesting nor successful simulated trading establishes that a strategy will remain profitable.
Frequently Asked Questions
1. Which price action strategy is easiest for beginners?
Support and resistance rejection is a straightforward starting point because traders can identify established zones and observe how prices respond before considering entries.
2. Can beginners trade price action without indicators?
Yes. Market structure, candlestick patterns, and support and resistance can form a complete analytical framework. Indicators are optional rather than essential.
3. Which timeframe works best for price action trading?
Daily and four-hour charts are useful starting points because they generally contain fewer short-term fluctuations than one-minute charts. The appropriate timeframe depends on trading objectives.
4. Is price action trading consistently profitable?
Not automatically. Profitability depends on execution, market conditions, costs, risk management, and whether the strategy has a measurable statistical advantage.
Final Thoughts
Price action trading becomes more useful when beginners stop searching for perfect formations and start evaluating the complete market picture.
A rejection candle means little without relevant support. A breakout means little without considering nearby resistance and the potential for false signals.
I recommend beginning with one strategy, studying historical examples, and practicing through a simulated account before considering real capital.
Keep position sizes conservative, record every decision, and evaluate results over a meaningful series of trades.
The strongest trading habit is not predicting every price movement. It is knowing exactly why a trade deserves consideration—and when staying out makes more sense.