

A pin bar can look like the perfect reversal signal, yet entering too early can turn a promising setup into an unnecessary loss. The difference often comes down to timing, location, and risk management.
Understanding pin bar trading strategy entry rules helps traders distinguish meaningful price rejection from ordinary market fluctuations. Instead of buying or selling every long-tailed candle, traders can use specific conditions to evaluate setups, place orders, and control potential losses. The goal isn’t to predict every reversal. It’s to develop a repeatable process for recognizing trading opportunities worth considering.
What Does a Pin Bar Reveal About Market Behavior?
A pin bar is a single candlestick characterized by a long shadow, a relatively small body, and a short opposite wick. Its extended shadow suggests that price moved strongly in one direction before retreating.
Two common formations appear on financial charts:
- Bullish pin bar: A long lower shadow indicates that buyers pushed prices higher after a decline.
- Bearish pin bar: A long upper shadow suggests that sellers regained control following an upward move.
A useful screening guideline is that the dominant shadow should occupy approximately two-thirds of the candle’s entire range. However, appearance alone doesn’t establish whether a reversal will follow.
The CFA Institute’s educational material on technical analysis explains that chart interpretation involves subjective judgment, even when traders follow predefined rules. That makes market context essential.
Three Pin Bar Trading Strategy Entry Rules Worth Understanding
Traders generally use three approaches to enter positions after identifying a qualifying pin bar. Each provides a different balance between execution certainty, confirmation, and potential reward.
1. Enter After the Candle Closes
The simplest approach involves entering immediately after the pin bar finishes forming. For a bullish setup, traders buy after the candle closes. For a bearish setup, they sell after the close. This approach avoids missing a movement that begins immediately. However, entering without additional confirmation can expose traders to false reversals.
Market orders also introduce execution uncertainty. The SEC’s explanation of order types notes that execution prices can differ from displayed quotations.
2. Wait for Price to Break the Pin Bar
A confirmation-based entry requires price to move beyond the candle’s opposite end. For bullish formations, traders place a buy-stop order slightly above the candle’s high. For bearish formations, they place a sell-stop order slightly below its low.
The buffer might equal one minimum tick or another instrument-appropriate amount. This method requires evidence that price is moving in the anticipated direction before triggering an entry. Still, a breakout can fail immediately afterward.
3. Enter During a 50% Retracement

A retracement entry attempts to secure a more favorable price. Traders calculate the midpoint of the candle’s complete high-to-low range and place a limit order near that level.
For bullish setups, this means placing a buy-limit order below the prevailing price. For bearish setups, the sell-limit order sits above it. A midpoint entry can improve the potential reward relative to the stop distance. The disadvantage is straightforward: price might never return to the desired entry.
How to Identify a Pin Bar Worth Trading
Not every pin bar deserves attention. Stronger candidates typically combine several observable characteristics.
Look for Meaningful Price Levels
Pin bars appearing near established support or resistance zones may be more relevant than formations occurring in the middle of a trading range.
For example, a bullish rejection near previously tested support provides more context than an identical candle without nearby structure. Supply and demand areas can offer additional reference points.
Check the Higher-Timeframe Direction
A bullish pin bar forming during a broader uptrend may signal a possible continuation after a pullback.
Likewise, a bearish formation appearing near resistance during a downtrend may align with prevailing selling pressure. Countertrend trades require particular caution because the larger trend can resume.
Evaluate Candle Structure
A practical pin bar checklist includes:
- A dominant shadow covering roughly two-thirds of the candle.
- A compact real body positioned near the opposite end.
- A recognizable support, resistance, or structural reference.
- A completed candle rather than an unfinished formation.
- Adequate room before the next significant price barrier.
These conditions improve consistency in setup selection, but none guarantees profitability.
A Practical Pin Bar Trading Example
Consider a hypothetical US-listed stock trading near an established support zone around $50.
After briefly declining, the stock forms a bullish pin bar with these prices:
| Candle measurement | Price |
| High | $51.20 |
| Low | $49.20 |
| Open | $50.80 |
| Close | $51.00 |
| 50% retracement | $50.20 |
A trader using breakout confirmation might establish a hypothetical entry at $51.25.
Suppose the protective stop is $49.10.
The risk per share becomes:
$51.25 − $49.10 = $2.15
A hypothetical 1:2 risk-to-reward target would be:
$51.25 + ($2.15 × 2) = $55.55
If the trader wants to risk $86, the position-size calculation becomes:
$86 ÷ $2.15 = 40 shares
This calculation assumes execution at the intended prices and excludes transaction costs and slippage.
More importantly, the $55.55 target should be evaluated against nearby resistance rather than accepted automatically.
Where Should Stop-Loss and Profit Targets Go?
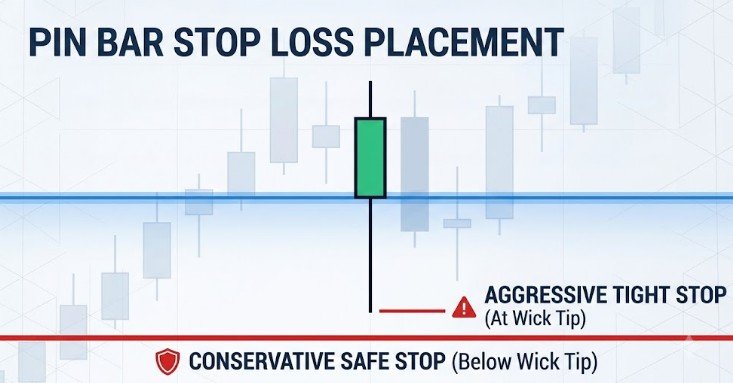
For bullish pin bars, traders commonly position protective stops slightly below the extended lower shadow. For bearish pin bars, stops generally sit above the upper shadow. A small buffer accommodates normal fluctuations, although an excessively wide stop increases potential losses.
The SEC’s guidance on stop orders explains that triggering a stop does not guarantee execution at the selected price. Profit targets should correspond to realistic chart structure.
Potential reference points include previous swing highs, swing lows, and established support or resistance areas. A 1:2 or 1:3 risk-to-reward ratio can serve as a planning benchmark, but neither guarantees a profitable strategy.
Common Pin Bar Mistakes That Undermine Results
One frequent mistake is entering before a candle closes. A promising rejection can disappear as prices continue moving. Another involves treating every long wick as a reliable trading signal. Pin bars appearing during major economic announcements, thin trading conditions, or unusually wide spreads deserve extra scrutiny.
The CFTC’s retail forex advisory warns that leverage magnifies trading losses and that most retail OTC forex customers lose money. Emotional decision-making creates additional problems.
Traders who repeatedly chase missed entries can benefit from learning how to control FOMO when trading US stocks.
How to Test Your Entry Rules Before Trading Live

Rather than assuming one entry method performs best, compare them using historical data. Record at least 50 qualifying setups for each method, ideally across different market environments. Track entry prices, stop distances, completed trades, missed entries, transaction costs, and average reward relative to risk. Also document whether the pin bar appeared near important market structure.
The CFA Institute’s trade execution guidance emphasizes that liquidity, volatility, and transaction conditions influence execution outcomes. Historical testing cannot guarantee future performance, but it can reveal whether a strategy has demonstrated a measurable advantage.
Frequently Asked Questions
1. What is the best entry point for a pin bar?
There is no universally superior entry. Breakout entries prioritize confirmation, midpoint entries seek better pricing, and market entries prioritize immediate participation. Results depend on market conditions.
2. Which timeframe works best for pin bar trading?
Four-hour and daily charts can provide clearer structural context, although pin bars appear on every timeframe. The appropriate choice depends on trading style and testing results.
3. Can pin bars produce false signals?
Yes. Price can temporarily reject a level before continuing its original direction. Support and resistance, trend alignment, and defined stop-loss rules help manage this uncertainty.
4. Is a 1:3 risk-to-reward ratio necessary?
No. A 1:3 ratio is a potential target, not a requirement. Traders should consider realistic price barriers, execution costs, and historically observed win rates.
Final Thoughts: Trade the Setup, Not Just the Candle
A pin bar may capture an important shift in buying or selling pressure, but the candle itself provides only part of the information. Reliable decision-making requires examining where the pattern forms, how the broader market behaves, and whether the potential reward justifies the risk.
I would prioritize consistency over finding the perfect entry. Choose one method, document its conditions, and evaluate it across different market environments before committing real capital. The most useful pin bar trading strategy is not necessarily the one producing the most signals. It is the one whose rules you can explain, test, and follow without improvisation.