

A stock can rise sharply for three consecutive days and still be stuck in a long-term downtrend. That distinction explains why traders sometimes mistake temporary rebounds for genuine market opportunities.
Understanding how to identify market trends in trading starts with recognizing price patterns rather than reacting to every market movement. By examining highs and lows, moving averages, trading volume, and momentum, traders can distinguish sustained price direction from short-lived volatility.
The objective isn’t to predict every market turn. It’s to recognize where buying or selling pressure is developing and make better-informed decisions.
What Defines a Market Trend?
A market trend describes the general direction of an asset’s price over a particular period. It reflects the ongoing balance between buyers and sellers.
According to the CFA Institute’s technical analysis research, traders commonly examine historical prices, chart patterns, and moving averages to evaluate market movements.
Three conditions deserve attention:
- Uptrend: Prices establish progressively higher peaks and higher pullbacks.
- Downtrend: Prices produce declining peaks and increasingly lower bottoms.
- Sideways market: Prices fluctuate within a relatively stable range without sustained directional movement.
These classifications depend on the timeframe. A stock experiencing an intraday rally could simultaneously remain in a bearish weekly trend.
Understanding how to read financial charts for beginners can help traders interpret price movements, identify support and resistance levels, and distinguish developing trends from temporary fluctuations before applying more advanced technical indicators.
Understanding that difference helps traders avoid confusing a temporary price recovery with a lasting reversal.
Read Price Structure Before Adding Indicators
Price action provides direct evidence of how market participants behave. Studying historical turning points often reveals whether buyers or sellers maintain control.
Higher Highs Reveal Buying Strength
A bullish trend typically develops when buyers push prices above previous peaks while defending increasingly higher pullback levels.
Imagine a stock advancing from $80 to $92, retreating to $86, and subsequently climbing to $98. The new high exceeds the previous peak, while the pullback holds above the earlier starting level.
Together, those movements suggest strengthening demand. However, one higher high alone does not establish a dependable trend.
Lower Lows Signal Selling Pressure
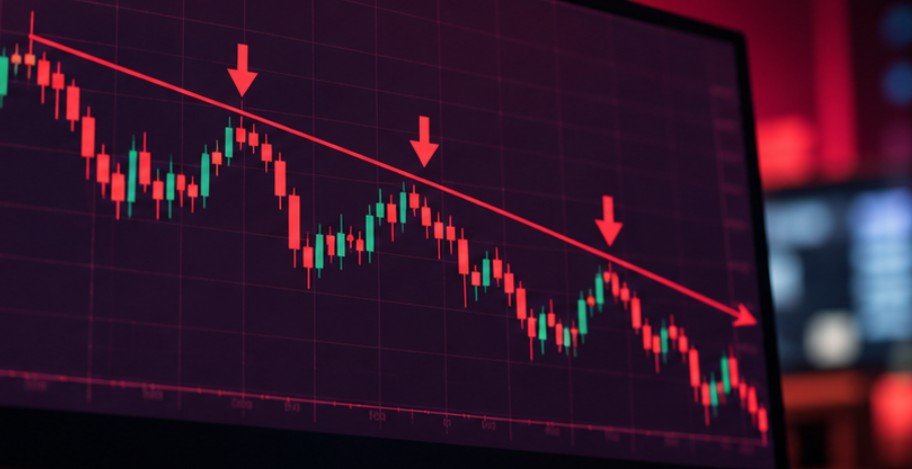
Bearish conditions appear when rallies repeatedly fail below previous peaks and prices continue establishing lower bottoms. For example, a stock might decline from $120 to $108, recover to $114, and then fall to $102.
The weaker recovery suggests sellers are entering before the previous high is reached. Traders typically monitor whether this structure continues rather than assuming every downward movement represents a profitable short-selling opportunity.
Recognize Consolidation Before a Breakout
Sideways conditions develop when neither buyers nor sellers establish lasting control. A stock repeatedly trading between $45 and $50 demonstrates an identifiable price range. The lower boundary represents potential support, while the upper boundary represents resistance.
A sustained move beyond either boundary may indicate a developing trend, although false breakouts remain common.
Draw Trend Lines Around Meaningful Price Levels
Trend lines simplify complicated charts by highlighting recurring price turning points. For an upward trend, connect at least two significant rising lows. For a downward trend, connect declining highs.
A third interaction with the line can provide additional evidence that market participants are responding to that area.
However, technical support and resistance should generally be treated as zones rather than perfectly precise prices.
A temporary movement below an ascending trend line does not automatically confirm a bearish reversal. Instead, examine whether the price closes below support, whether subsequent rallies fail, and whether trading participation strengthens during the decline. This approach reduces the temptation to respond impulsively to every broken line.
Use Moving Averages to Confirm Market Direction
Moving averages smooth daily price fluctuations, making the underlying direction easier to evaluate. The 50-day and 200-day simple moving averages are widely followed in American equity markets.
Compare Price Against the Average
A stock trading consistently above a rising 50-day moving average may demonstrate positive intermediate-term momentum. A stock remaining below a declining 200-day average can indicate broader weakness.
The slope matters as much as the price position. An average moving sideways provides less directional evidence than one rising or falling consistently.
Moving averages can help traders observe price trends, but economic conditions also influence the direction of stocks, bonds, and currencies. Understanding how interest rates affect financial markets provides useful context for interpreting price movements following central-bank decisions and changes in borrowing costs.
Exponential moving averages emphasize recent prices, making them more responsive but potentially more vulnerable to short-term noise.
Understand Golden Crosses and Death Crosses

A golden cross occurs when the 50-day moving average rises above the 200-day average. The opposite movement creates a death cross. These signals can suggest changing market conditions, but both rely on historical information.
Consequently, crossovers often appear after significant price movement has already occurred. The CMT Association’s research on moving averages discusses their practical uses and limitations, reinforcing why they should supplement price analysis rather than replace it.
Check Whether Volume and Momentum Support the Trend
Price direction becomes more informative when examined alongside market participation.
Volume Shows Participation, Not Certainty
Trading volume measures the number of shares or contracts exchanged during a specified period.
An upward breakout accompanied by unusually strong volume may carry greater significance than a similar movement with limited participation. Compare current activity against the average volume over the preceding 20 sessions.
For example, a breakout generating 2 million shares against a typical daily volume of 1 million indicates unusually active trading.
Nevertheless, high volume can accompany aggressive selling as well as buying. Direction and price behavior remain essential.
Momentum Indicators Provide Another Perspective
The Relative Strength Index measures the speed and magnitude of recent price changes.
Readings above 70 traditionally indicate overbought conditions, while readings below 30 suggest oversold conditions. Neither reading guarantees a reversal.
Strong trends can remain overbought or oversold for extended periods. The Average Directional Index, meanwhile, estimates trend strength without identifying its direction. Traders can combine these tools to assess whether a directional movement is gaining or losing momentum.
Compare Multiple Timeframes Before Making Decisions

One chart rarely reveals the complete market picture.
A practical approach involves examining three timeframes:
- Weekly chart: Identify the dominant long-term direction.
- Daily chart: Evaluate intermediate support, resistance, and price structure.
- Hourly chart: Look for potential entry opportunities consistent with the broader trend.
Consider a stock maintaining higher weekly lows while experiencing a temporary decline on its hourly chart.
That short-term weakness could represent a normal pullback rather than the beginning of a broader bearish movement.
Timeframe alignment does not eliminate uncertainty, but it helps traders distinguish meaningful changes from routine fluctuations.
Why Trend Analysis Sometimes Fails
Technical indicators describe historical behavior. They cannot guarantee future market direction. Unexpected earnings announcements, Federal Reserve decisions, economic reports, and geopolitical developments can rapidly invalidate existing patterns.
Currency movements can also influence trend reliability, particularly for forex traders and investors holding international assets. Understanding how currency value changes affect trading strategies helps traders account for exchange-rate fluctuations, interest-rate expectations, and economic developments when evaluating price trends and managing market risk.
The Securities and Exchange Commission warns that active day trading carries substantial financial risks, particularly when borrowed money magnifies losses. Similarly, Investor.gov’s risk guidance explains that uncertainty and potential financial loss are inherent in investment decisions.
Traders should also recognize that thinly traded assets may produce misleading breakouts because relatively small orders can move prices sharply. For leveraged futures and currency positions, the National Futures Association emphasizes using capital that traders can afford to lose.
Frequently Asked Questions
1. What is the easiest way to identify a market trend?
Start by examining higher highs and higher lows for bullish conditions, or lower highs and lower lows for bearish conditions. Confirm the pattern using a moving average.
2. Which indicator is best for identifying market trends?
Moving averages are useful for direction, while ADX evaluates trend strength. Neither works consistently in every market, making price structure and volume valuable additional checks.
3. Can beginners identify market trends without indicators?
Yes. Beginners can examine candlestick charts, identify recurring turning points, and draw basic trend lines before introducing technical indicators.
4. How can traders distinguish a pullback from a reversal?
A pullback generally preserves the broader trend structure. A potential reversal becomes more credible when important swing levels break and subsequent price action confirms the change.
Final Thoughts
Successful trend analysis depends less on predicting the next candle and more on interpreting the evidence already visible.
I believe the most practical starting point is a simple chart showing price structure, one or two moving averages, and trading volume. Those elements can reveal meaningful changes without overwhelming the decision-making process.
Before acting, I would also check the broader market, determine an invalidation level, and assess potential losses.
A convincing trend is never a guarantee of profit. The real advantage comes from recognizing when several independent observations support the same interpretation—and knowing when the evidence is too weak to justify a trade.