
A stock can rise 5% in one week and still be heading toward a longer-term decline. That is why understanding price movement matters more than simply checking whether a stock is green or red. Learning how to read financial charts for beginners starts with three essentials: recognizing price trends, understanding trading activity, and identifying important price levels.
Financial charts turn market data into visual patterns, helping investors evaluate stocks, exchange-traded funds (ETFs), and other financial assets. Once you understand their basic components, these charts become useful tools for making more informed investment decisions.
What Is a Financial Chart and How Does It Work?
A financial chart illustrates how an asset’s market price changes over a selected period. Investors use these charts to study historical performance, examine volatility, and recognize potential market trends.
Most financial charts contain two primary axes:
- Horizontal axis (X-axis): Displays time, ranging from minutes to several years.
- Vertical axis (Y-axis): Displays the asset’s price or value.
For example, a stock chart showing prices between $80 and $120 over six months reveals how the investment performed during that period.
However, the same stock might appear highly volatile on a daily chart but relatively stable over five years.
This difference explains why choosing an appropriate timeframe is essential before interpreting market movements.
Understanding the Three Main Types of Financial Charts
Different chart formats highlight different aspects of trading activity. Beginners should understand three common options before exploring technical indicators.
Line Charts: The Easiest Starting Point
A line chart connects closing prices across consecutive trading periods.
Its simplicity makes it particularly useful for identifying broad market direction without distractions from daily price fluctuations.
For example, a line moving steadily upward over twelve months suggests that the asset has appreciated during that period.
However, line charts generally exclude information about the highest and lowest prices reached during each session.
Bar Charts: Understanding Daily Price Ranges
Bar charts provide four important price measurements, collectively called OHLC:
- Open: The first traded price during the period.
- High: The highest traded price.
- Low: The lowest traded price.
- Close: The final traded price.
Each vertical bar represents a trading period, while small horizontal marks indicate opening and closing prices.
This format helps investors understand whether prices experienced significant fluctuations before the session ended.
Candlestick Charts: Seeing Price Behavior Clearly
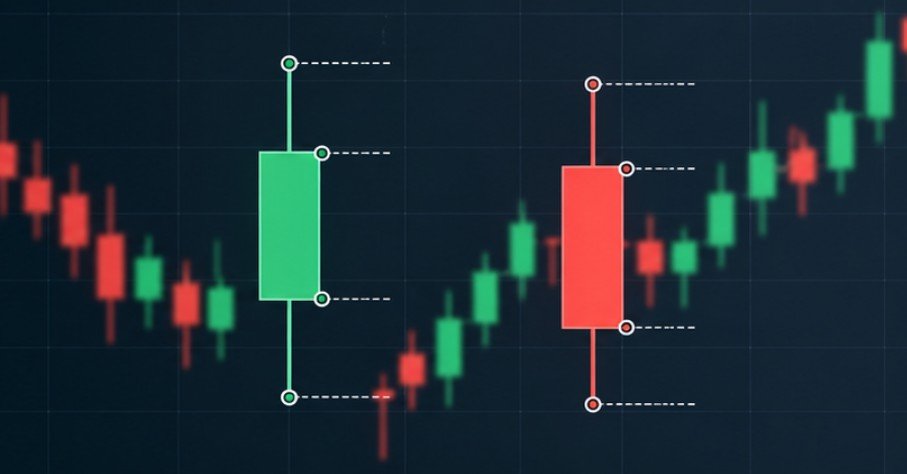
Candlestick charts display the same OHLC information through colored rectangular bodies and thin lines called wicks.
Their visual structure makes them especially useful for identifying buying and selling pressure.
The CFA Institute’s technical analysis educational material explains how price patterns and technical indicators help analysts evaluate market behavior.
For beginners, candlestick charts provide a practical balance between detailed information and readability.
How to Read Candlestick Patterns Without Getting Confused
Every candlestick represents price movement within a particular timeframe. A daily candle summarizes one trading session, while a weekly candle represents an entire trading week.
Understanding Candle Colors and Bodies
A green or white candle generally indicates that the closing price exceeded the opening price. A red or black candle usually means the closing price finished below the opening price. For a green candle, the body’s bottom represents the opening price and its top represents the closing price. The positions reverse for a red candle.
Long bodies indicate substantial differences between opening and closing prices, while short bodies suggest relatively limited net movement.
What Upper and Lower Wicks Reveal
Wicks show the highest and lowest prices reached during the selected period.
Consider a stock with these hypothetical daily prices:
- Opening price: $100
- Highest price: $108
- Lowest price: $98
- Closing price: $105
The candle would have a green body between $100 and $105, an upper wick reaching $108, and a lower wick extending to $98.
The upper wick indicates that the stock traded above its eventual closing price.
These details provide clues about intraday price behavior, although one candle cannot reliably predict the next trading session.
How to Identify Market Trends Using Financial Charts
Recognizing the broader trend is one of the most valuable chart-reading skills. Financial markets generally exhibit three common directional patterns.
Uptrend: Higher Highs and Higher Lows
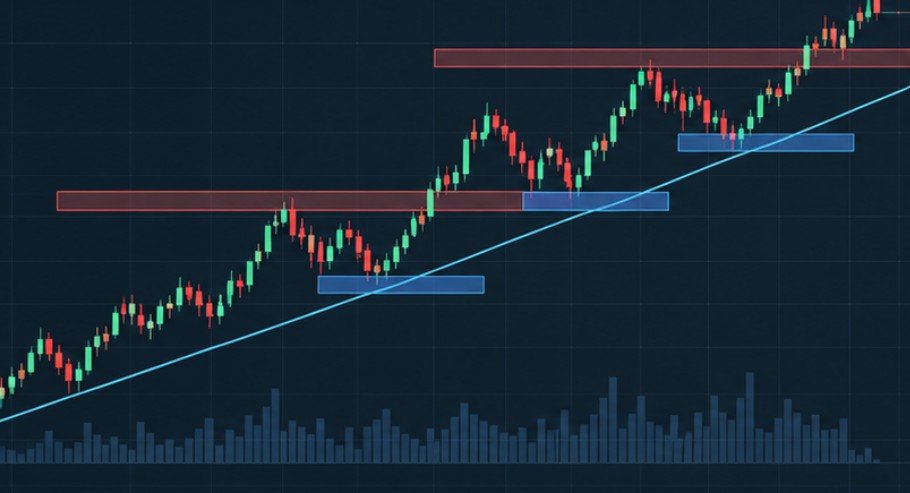
An uptrend develops when prices repeatedly establish higher peaks and higher pullback levels. For example, a stock might move from $50 to $60, retreat to $55, and subsequently climb to $65. This sequence suggests upward momentum, although temporary declines remain possible.
For forex traders, understanding market structure in forex adds another layer to trend analysis by examining how price swings form higher highs, higher lows, lower highs, and lower lows. These patterns can help traders assess the prevailing direction of a currency pair, although they should be considered alongside broader market conditions and risk management.
Downtrend: Lower Highs and Lower Lows
A downtrend shows the opposite behavior. Prices establish progressively lower peaks and lower bottoms, indicating sustained downward pressure.
Investors should distinguish a genuine downtrend from an ordinary correction within a longer-term upward movement.
Sideways Markets: Trading Without Clear Direction
A sideways market occurs when prices repeatedly fluctuate within a relatively stable range. For instance, a stock might trade between $70 and $78 for several weeks. Such movement indicates that neither buyers nor sellers have established a sustained directional advantage.
Support and Resistance: Finding Important Price Zones
Support and resistance describe price areas where market behavior has previously changed. Support represents an area where buying interest has historically been sufficient to slow or reverse declines. Resistance describes an area where selling interest has previously interrupted upward movement.
Imagine a stock repeatedly recovering near $90 but struggling to move above $110. Traders might identify $90 as potential support and $110 as resistance. These levels are better treated as approximate zones rather than guaranteed turning points.
A price breaking above resistance may signal improving momentum, but false breakouts occur frequently.
Identifying potential entry and exit levels is only one part of managing a trade; traders also need a plan for limiting losses if the market moves against them. Learning how to set a stop loss using ATR can help traders use the Average True Range (ATR) indicator to account for an asset’s recent volatility when determining stop-loss distances.
How Volume and Moving Averages Improve Chart Analysis
Price direction becomes more meaningful when examined alongside trading activity and historical averages.
Trading Volume Shows Market Participation
Volume measures the number of shares or contracts traded during a particular period. It usually appears as vertical bars beneath the price chart.
A breakout accompanied by unusually high volume may attract greater attention because more trading activity supports the move. However, volume alone cannot establish whether prices will continue rising.
Another tool beginners can explore after learning basic chart patterns is the RSI divergence trading strategy, which compares price movements with the Relative Strength Index (RSI) to identify potential momentum shifts. Like other technical indicators, divergence signals require confirmation and should not be treated as guaranteed predictions.
Moving Averages Reveal Broader Direction
Moving averages smooth historical price movements by calculating average prices across selected periods.
Two commonly used indicators are:
- 50-day moving average: Helps identify intermediate-term price direction.
- 200-day moving average: Provides perspective on longer-term trends.
Prices consistently trading above a rising moving average can suggest relative strength.
Nevertheless, moving averages react to past prices and may provide delayed signals during sudden market reversals.
Common Financial Chart Mistakes Beginners Should Avoid

One frequent mistake is treating technical patterns as reliable predictions rather than possible scenarios. Another is using extremely short timeframes for long-term investment decisions.
Charts also require context. Corporate earnings announcements, Federal Reserve decisions, and unexpected economic developments can quickly change market conditions.
Additionally, repeatedly buying and selling investments increases exposure to trading costs and execution risks. The FINRA’s day-trading risk disclosure guidance explains why frequent speculative trading can be particularly risky for inexperienced investors.
Chart analysis should complement broader investment research, not replace it.
For additional protection, the SEC’s guidance on diversification and asset allocation explains how spreading investments across different assets can help manage portfolio risk.
Frequently Asked Questions
1. What is the easiest financial chart for beginners?
A line chart is generally easiest because it displays closing prices without additional trading details. Candlestick charts become useful once you understand basic price movements.
2. Can financial charts predict stock prices accurately?
No. Charts reveal historical behavior and possible trends, but economic developments, company announcements, and unexpected events can produce unpredictable price movements.
3. Which timeframe should beginners use?
Daily and weekly charts are useful starting points because they provide market context without emphasizing every short-term price fluctuation.
4. Are moving averages necessary for reading financial charts?
No. Beginners can understand price direction without indicators. Moving averages simply make broader trends easier to visualize.
Final Thoughts
Financial charts become valuable when you understand what their movements represent rather than treating every price change as a trading opportunity.
Start by examining a line chart, progress to candlestick patterns, and gradually introduce support, resistance, and trading volume. Practice with historical charts before risking actual money.
Remember that a rising stock is not automatically a good investment, just as a falling price does not necessarily indicate a bargain.
The strongest chart-reading habit is combining technical observations with financial research, patience, and sensible risk management. A chart should help you ask better questions, not encourage impulsive decisions.